mpandroidchartlibrary-2-1-6.jar免费版是一个Android开源图表库MPAndroidChart的jar包,下载了mpandroidchartlibrary-2-1-6.jar免费版包即可使用后线图和饼图,软件支持选择、缩放和拖放。
使用实例
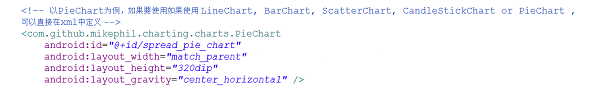
下面主要实现以下饼状图:
1.下载最新mpandroidchartlibrary-2-1-6.jar免费版包, 然后copy到项目的libs中
2.定义xml文件
3.主要Java逻辑代码如下,注释已经都添加上了。
package com.jackie.mpandroidpiechart;
import java.util.ArrayList;
import com.github.mikephil.charting.charts.PieChart;
import com.github.mikephil.charting.components.Legend;
import com.github.mikephil.charting.components.Legend.LegendPosition;
import com.github.mikephil.charting.data.Entry;
import com.github.mikephil.charting.data.PieData;
import com.github.mikephil.charting.data.PieDataSet;
import android.support.v7.app.ActionBarActivity;
import android.graphics.Color;
import android.os.Bundle;
import android.util.DisplayMetrics;
public class MainActivity extends ActionBarActivity {
private PieChart mChart;
@Override
protected void onCreate(Bundle savedInstanceState) {
super.onCreate(savedInstanceState);
setContentView(R.layout.activity_main);
mChart = (PieChart) findViewById(R.id.spread_pie_chart);
PieData mPieData = getPieData(4, 100);
showChart(mChart, mPieData);
}
private void showChart(PieChart pieChart, PieData pieData) {
pieChart.setHoleColorTransparent(true);
pieChart.setHoleRadius(60f); //半径
pieChart.setTransparentCircleRadius(64f); // 半透明圈
//pieChart.setHoleRadius(0) //实心圆
pieChart.setDescription("测试饼状图");
// mChart.setDrawYValues(true);
pieChart.setDrawCenterText(true); //饼状图中间可以添加文字
pieChart.setDrawHoleEnabled(true);
pieChart.setRotationAngle(90); // 初始旋转角度
// draws the corresponding description value into the slice
// mChart.setDrawXValues(true);
// enable rotation of the chart by touch
pieChart.setRotationEnabled(true); // 可以手动旋转
// display percentage values
pieChart.setUsePercentValues(true); //显示成百分比
// mChart.setUnit(" €");
// mChart.setDrawUnitsInChart(true);
// add a selection listener
// mChart.setOnChartValueSelectedListener(this);
// mChart.setTouchEnabled(false);
// mChart.setOnAnimationListener(this);
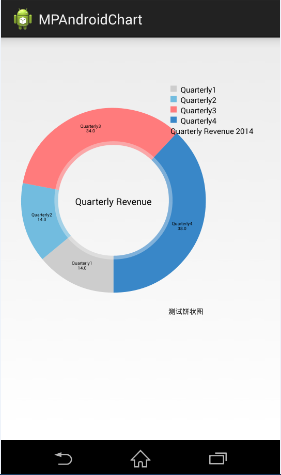
pieChart.setCenterText("Quarterly Revenue"); //饼状图中间的文字
//设置数据
pieChart.setData(pieData);
// undo all highlights
// pieChart.highlightValues(null);
// pieChart.invalidate();
Legend mLegend = pieChart.getLegend(); //设置比例图
mLegend.setPosition(LegendPosition.RIGHT_OF_CHART); //最右边显示
// mLegend.setForm(LegendForm.LINE); //设置比例图的形状,默认是方形
mLegend.setXEntrySpace(7f);
mLegend.setYEntrySpace(5f);
pieChart.animateXY(1000, 1000); //设置动画
// mChart.spin(2000, 0, 360);
}
/**
*
* @param count 分成几部分
* @param range
*/
private PieData getPieData(int count, float range) {
ArrayList xValues = new ArrayList(); //xVals用来表示每个饼块上的内容
for (int i = 0; i < count; i++) {
xValues.add("Quarterly" + (i + 1)); //饼块上显示成Quarterly1, Quarterly2, Quarterly3, Quarterly4
}
ArrayList yValues = new ArrayList(); //yVals用来表示封装每个饼块的实际数据
// 饼图数据
/**
* 将一个饼形图分成四部分, 四部分的数值比例为14:14:34:38
* 所以 14代表的百分比就是14%
*/
float quarterly1 = 14;
float quarterly2 = 14;
float quarterly3 = 34;
float quarterly4 = 38;
yValues.add(new Entry(quarterly1, 0));
yValues.add(new Entry(quarterly2, 1));
yValues.add(new Entry(quarterly3, 2));
yValues.add(new Entry(quarterly4, 3));
//y轴的集合
PieDataSet pieDataSet = new PieDataSet(yValues, "Quarterly Revenue 2014"/*显示在比例图上*/);
pieDataSet.setSliceSpace(0f); //设置个饼状图之间的距离
ArrayList colors = new ArrayList();
// 饼图颜色
colors.add(Color.rgb(205, 205, 205));
colors.add(Color.rgb(114, 188, 223));
colors.add(Color.rgb(255, 123, 124));
colors.add(Color.rgb(57, 135, 200));
pieDataSet.setColors(colors);
DisplayMetrics metrics = getResources().getDisplayMetrics();
float px = 5 * (metrics.densityDpi / 160f);
pieDataSet.setSelectionShift(px); // 选中态多出的长度
PieData pieData = new PieData(xValues, pieDataSet);
return pieData;
}
}
主要是一些基本属性和API的调用,具体每个API都有什么样的效果和作用,只能靠自己去尝试。后面还会陆陆续续为大家介绍MPAndroidChart其他类型的图表。
mpandroidchartlibrary-2-1-6.jar
 Resource Hacker 最新版 v5.2.1.376
 Java SE Development Kit v18.0.2.1
 IntelliJ IDEA2021 最新版 v2021
 CiteSpace 中文版v5.7
 Java 7 Update 67 v7.0
 Myeclipse2021 最新版 v2021